ESP32 Thermal Camera Viewer
A real-time thermal imaging system that streams 80x62 resolution frames from an ESP32-S3 to a Node.js web interface via TCP and WebSockets. It features a comprehensive dashboard with temperature overlays, live charting, and multiple color map presets for visual analysis.
Thermal imaging has become increasingly accessible for hobbyists and engineers, and this project demonstrates how to leverage the ESP32-S3 to create a high-performance thermal viewing station. By combining robust firmware with a modern web interface, the project enables real-time visualization of heat signatures with features typically found in professional equipment.
Hardware and Firmware Architecture
The project is designed specifically for the Waveshare Thermal-Camera-ESP32-Module, which utilizes the MI0802 sensor. This sensor provides an 80x62 thermal resolution, offering a balance between detail and data throughput.
The firmware is built using ESP-IDF (specifically version 5.2.x), taking advantage of the framework’s multi-tasking capabilities. The ESP32 acts as a TCP server, listening on port 3333. It handles sensor data acquisition, local hardware management (including LED and LCD control), and network streaming simultaneously. To get the system running, users configure their Wi-Fi credentials via the ESP-IDF menuconfig and flash the device, at which point it begins broadcasting thermal data over the local network.
The Node.js Web Interface
While the ESP32 handles the raw data, the heavy lifting for visualization is moved to a Node.js-based web viewer. This architecture allows for a much richer user experience than a standalone embedded display could provide. The Node.js client connects to the ESP32’s TCP server, receives the raw thermal frames, and relays them to a web browser using WebSockets.
This bridge enables a high-resolution, full-screen heatmap viewer that can be accessed from any modern browser on the local network. The web interface scales the 80x62 sensor data onto a larger canvas, providing a smooth and clear visual representation of the thermal environment.
Advanced Visualization Features
The web viewer is packed with tools for thermal analysis:
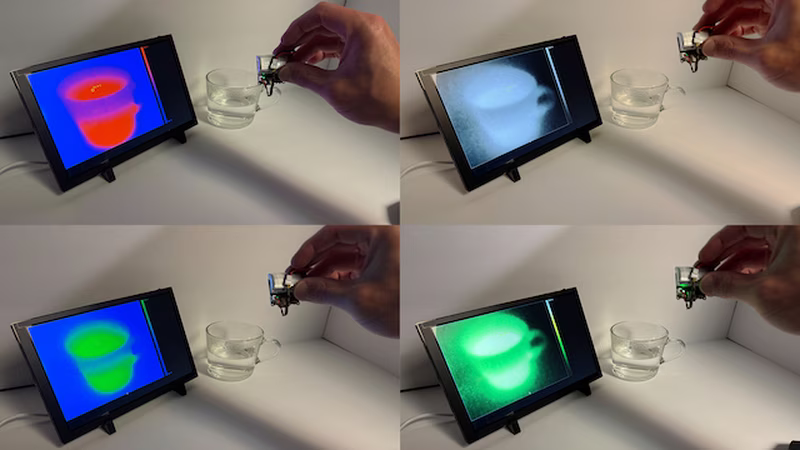
- Color Map Presets: Users can toggle between various palettes including Inferno, Plasma, Hot, and Fire & Ice to better distinguish temperature gradients.
- Live Analytics: The interface tracks FPS and provides a live graph showing minimum and maximum temperatures over time.
- Temperature Overlays: A dynamic target tracks the maximum temperature point in the frame, providing an instant readout.
- Customization: The UI includes a vertical range bar with color matching, support for both Celsius and Fahrenheit, and a toggle to flip the image horizontally.
- Data Capture: A built-in screenshot feature allows users to save thermal frames directly from the browser.
Getting Started
Setting up the project involves two main steps. First, the ESP32 firmware must be built and flashed using the ESP-IDF environment. Once the device is powered on and connected to Wi-Fi, it will display its IP address. Second, the Node.js application is configured with this IP address. After running npm install and starting the client, the thermal stream becomes available at http://localhost:8080, providing an immediate window into the infrared spectrum.