Air Quality Monitor
An ESP32-powered air quality monitoring system featuring the Sensirion SEN66 sensor and a LilyGO TTGO T-Display. It tracks CO2, particulate matter, VOC, and NOx indices, offering both a local TFT interface and a responsive web dashboard with historical graphing and JSON API support.
Overview
The Air Quality Monitor is a sophisticated embedded solution designed for real-time environmental tracking. Built around the powerful ESP32-based LilyGO TTGO T-Display and the high-precision Sensirion SEN66-SIN-T sensor, this project provides a comprehensive overview of indoor air quality. It moves beyond simple CO2 monitoring to include particulate matter (PM1.0, PM2.5, PM4.0, PM10), VOC (Volatile Organic Compounds) index, and NOx index, alongside standard temperature and humidity readings.
Hardware Integration
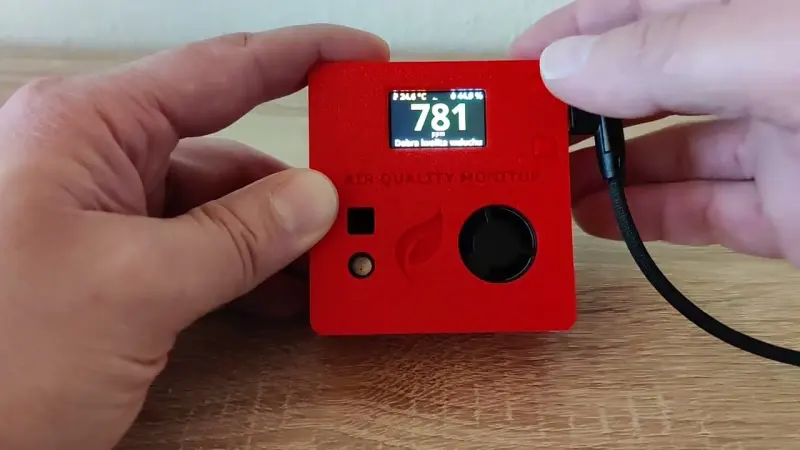
The heart of the system is the Sensirion SEN66 sensor, which is connected via I2C to the LilyGO TTGO T-Display. The T-Display’s integrated 1.14-inch LCD provides an immediate visual interface, while the ESP32 microcontroller handles data processing, WiFi connectivity, and web hosting. The project is designed to be powered via USB-C, making it suitable for desktop or wall-mounted use within a custom 3D-printed enclosure.
Visual Interface and User Experience
The firmware utilizes the TFT_eSPI library to drive a multi-screen interface. The main screen displays the most critical metrics: temperature, humidity, and CO2 levels. A color-coded system provides instant feedback on air quality based on CO2 concentrations—ranging from green (good) to red (poor/ventilation required).
Physical interaction is handled through the onboard buttons:
- S1 Button: Cycles through secondary screens showing individual values for PM concentrations.
- S2 Button: Returns the user to the main overview screen.
To preserve the longevity of the display, the project includes an automatic screensaver feature that dims the backlight after 30 seconds of inactivity.
Connectivity and Web Features
One of the standout features of this monitor is its integrated web server. By navigating to the device’s IP address, users can access a responsive dashboard that displays all sensor data in a tabular format. The web interface also includes:
- Historical Graphs: Visualizing CO2, temperature, and humidity trends over the last 12 hours.
- JSON API: A
/nowendpoint that returns current sensor readings in a machine-readable format, allowing for easy integration into home automation systems like Home Assistant. - OTA Updates: The “Service” section of the web portal allows for wireless firmware upgrades using ElegantOTA, eliminating the need to connect the device to a computer for maintenance.
Technical Configuration
The project is highly configurable via the settings.h file. Users can define WiFi credentials, static IP addresses, and measurement intervals. By default, the system samples data every 15 minutes and maintains a history of 48 samples, providing a rolling 12-hour window of environmental data.
// Example configuration in settings.h
const unsigned long UPDATE_INTERVAL_MS = 15 * 60 * 1000; // 15 minutes
const int HISTORY_LENGTH = 48; // 12 hours of history
const unsigned long SCREENSAVER_DELAY_MS = 30000; // 30 seconds
const int BACKLIGHT_BRIGHTNESS = BRIGHTNESS_LOW; // 25% brightness for screensaver
This monitor represents a complete, end-to-end IoT application, combining precise sensing, local visualization, and remote data access in a compact, DIY-friendly package.