LinkScope BPU UART Analyzer
A high-speed UART analyzer using an ESP32-S3 bridge and a PC-based GUI for real-time serial data visualization. It supports baud rates up to 921600 and uses COBS framing to detect packet loss and analyze timing jitter in embedded systems.
Visualizing the Invisible: Real-Time UART Analysis
Debugging serial communication in embedded systems often feels like flying blind. While a standard serial terminal can show you the characters being sent, it rarely provides insight into timing jitter, buffer health, or the exact moment a packet drops. LinkScope BPU UART Analyzer solves this by transforming an ESP32-S3 into a dedicated hardware bridge that captures and streams UART data to a powerful PC-based visualization tool.
Designed for developers working with STM32, ESP32, nRF, and other microcontrollers, LinkScope provides a high-resolution window into your serial streams. By utilizing the native USB capabilities of the ESP32-S3, it achieves stable throughput at high baud rates, making it suitable for modern, data-heavy embedded applications.
High-Performance Hardware Bridge
The project architecture is straightforward yet effective. The target MCU’s TX line is connected to a specific GPIO on the ESP32-S3 (defaulting to GPIO18). The ESP32-S3 acts as a high-speed probe, capturing incoming bytes and encapsulating them using Consistent Overhead Byte Stuffing (COBS). This framing protocol ensures that the binary data can be reliably transmitted over USB to the host PC without losing synchronization, even if the stream contains null bytes or control characters.
Key capabilities include:
- High-Speed Capture: Supports baud rates up to 921600.
- Real-Time Statistics: Monitors throughput, frame counts, and health metrics.
- Protocol Awareness: Uses COBS framing for robust binary data handling.
- Visualization: Includes a real-time throughput graph and a RAW hex inspector.
Getting Started with LinkScope
Setting up LinkScope requires no complex toolchains. The firmware is provided as an Arduino-compatible sketch, allowing for quick deployment to any ESP32-S3 development board.
Firmware Configuration
The firmware utilizes the HardwareSerial class to manage the high-speed input and the built-in USB CDC functionality for host communication. Once the firmware is flashed, the hardware connection is minimal:
Target MCU TX  --->  ESP32-S3 GPIO18 (RX)
Target MCU GND --->  ESP32-S3 GND
Host Analyzer
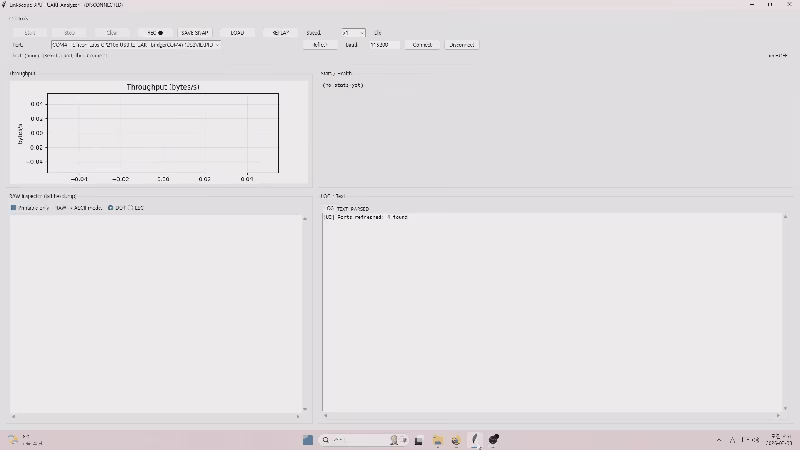
The PC side of the project features a Windows-compatible standalone executable, though it can also be run directly from source using Python. The analyzer provides a GUI to select the COM port, set the target baud rate, and start the monitoring process. Once connected, the tool offers immediate feedback on the data stream, allowing you to stop, start, and clear the buffer as needed.
Example Implementation
To demonstrate the analyzer’s capabilities, the repository includes example firmware for a target MCU (like an ESP32-WROOM). This example shows how to format packets with magic bytes and CRC-16 checksums to ensure data integrity:
// Example of a formatted packet structure used for testing
struct Packet {
    uint8_t magic[2]; // 0xAA, 0x55
    uint32_t seq;
    char message[10];
    uint16_t crc;
};
By sending these structured packets, users can test the analyzer’s ability to decode frames and detect sequence gaps, which are indicative of hardware or software-induced data loss.
Applications in Embedded Development
LinkScope is particularly useful for scenarios where timing is critical. Whether you are reverse engineering a proprietary protocol, benchmarking the throughput of a new driver, or factory testing production units, the ability to see jitter and packet loss in real-time is invaluable. It bridges the gap between a simple serial monitor and an expensive logic analyzer, providing a software-centric view of serial data health.
Related Projects
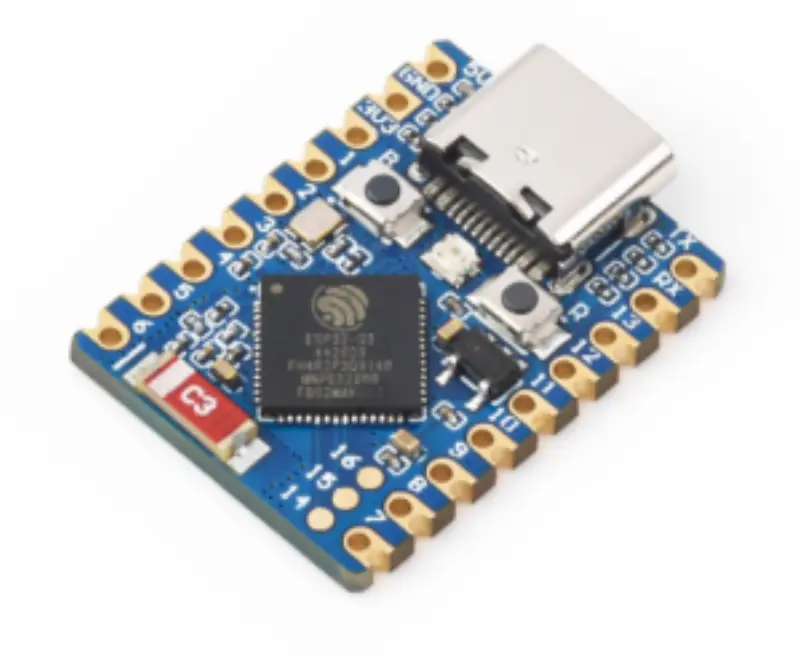
esp-nus — High-throughput BLE 5 UART bridge
A transparent UART-to-BLE cable replacement for the ESP32-C6 that implements the Nordic UART Service (NUS). It is specifically optimized for high throughput using BLE 5 features like LE 2M PHY, Data Length Extension (DLE), and credit-based flow control.

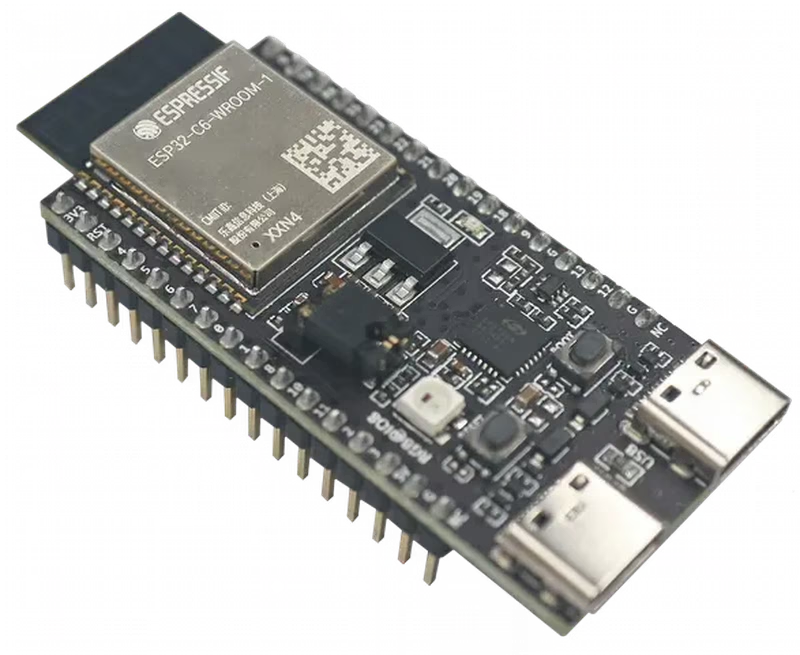
ESP CAN-Analyzer
An ESP32-based bridge that interfaces CAN bus systems with IoT environments using the Lawicel (SLCAN) protocol. It supports real-time CAN data monitoring and transmission via a web interface, Serial, or WebSockets, and is designed for automotive and industrial applications.
ESP32 UART Bridge
A high-performance serial communication hub for ESP32 and ESP32-S3 microcontrollers that bridges UART data to USB, WiFi, and Bluetooth. It features protocol-aware optimizations for MAVLink, SBUS, and CRSF, and includes a comprehensive web-based configuration interface.
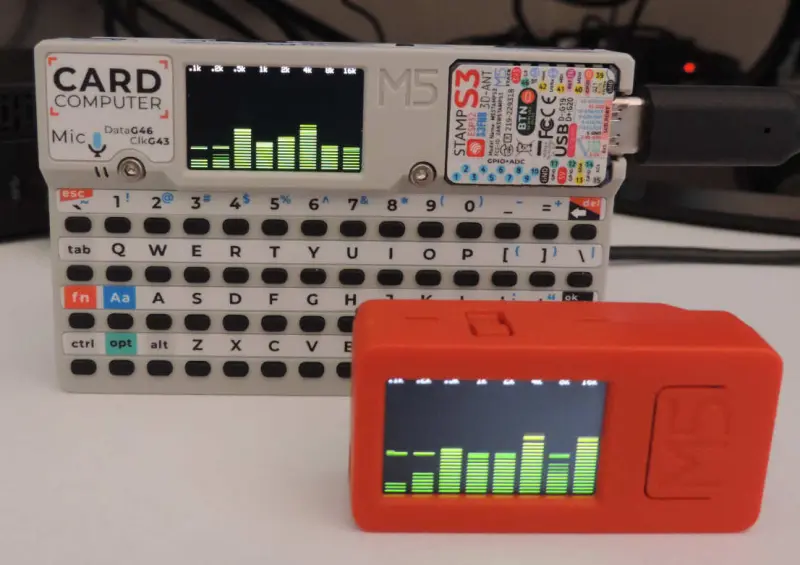
M5Cardputer Audio Spectrum Display
A real-time audio analysis application for the M5Cardputer that provides a spectrum analyzer, oscilloscope, and musical tuner. It utilizes the ESP32-S3's I2S interface for high-speed microphone sampling and implements fixed-point FFT and wavelet-based pitch tracking for efficient signal processing.
ESP-Scope
ESP-Scope is a web-based oscilloscope application built on the ESP-IDF framework for ESP32 microcontrollers. It utilizes the ESP32's ADC capabilities to capture analog signals and serves a real-time visualization interface via a web browser, supporting sample rates up to 83.3 kHz.